Proprietary research
The State of Solutions Comp Structures 2026
How the best teams do solution compensation.

Solutions comp structures are a black box - hard to benchmark, hard to explain, and even harder to advocate for internally.
In this research, we share what over 200 presales/Solutions teams are actually doing across base/variable splits, variable components, and incentive levers (surveyed Oct–Dec 2025, US + Europe).
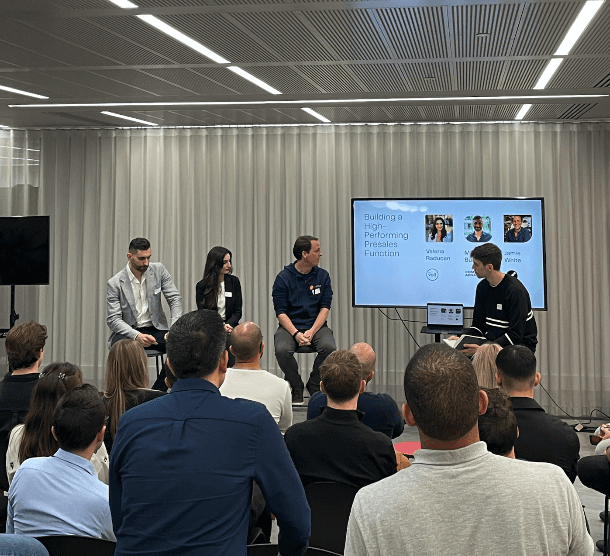
At Coform, our goal is to help power Solutions to be the trusted, scalable, repeatable growth lever it should be. Our invite-only community meets monthly across four cities (with more coming) and virtually, openly sharing what's actually working and not.
Out of that community, we're building solutions to problems our members have with Focal (our Solutions OS that helps teams execute and prove impact) and Method (crowd-sourced benchmarks and research so teams can design and advocate more effectively).
Our first report is designed to help you understand what’s normal across the market in Solutions comp structures - and what most strongly drives satisfaction.
Research by Esin Cansu Yilmaz
Research Partners
The partners below helped share the report with their communities and teams, extending its reach and strengthening its relevance. We’re grateful to collaborate with people who care deeply about advancing the Solutions profession.

Key Takeaways
This benchmark covers 200+ Solutions teams across the US and Europe (Oct–Dec 2025). It’s not about comp amounts - it’s about how plans are structured, what’s considered “normal,” and what correlates with satisfaction.
Nearly all Solutions teams have variable comp - and the market standard is clustered around 80:20 and 70:30.
87% of teams have a variable aspect of their compensation, with 70:30 the most common split (closely followed by 80:20).
Most Solutions compensation is designed as a team sport - however, with a growing need to recognise individual impact.
Team / region / pod-based measures show up in the majority of plans. Many teams pair this with individual recognition mechanisms (e.g., MBOs, kickers, SPIFs) to make personal impact visible without undermining collaboration.
Clarity consistently matters more than a perfect structure.
The highest satisfaction plans share one trait: people can clearly explain what they’re paid on, what they can influence, and how payout is calculated. Across structures, confusion (too many levers, unclear crediting, “mystery” measures) is one of the most reliable signals of lower satisfaction.
Extra levers (SPIFs, accelerators, multiple metrics) work best when they reinforce a simple core plan.
27% of teams use SPIFs, accelerators, or bounties. These tools are most effective when they’re used to spotlight priority behaviour (e.g., new products, big deals, multi-SKU) on top of a plan the team already understands — rather than as a substitute for core plan clarity.
Perceived alignment and fairness across Sales + Solutions is a major driver of satisfaction.
Two patterns show up repeatedly:
SE satisfaction tends to be higher when incentives across AE/SE feel aligned and proportionate to shared effort.
When AE plans become much more heavily variable, SE satisfaction with their own comp often declines - suggesting that how the “whole package” feels (pressure, recognition, shared upside) matters as much as the SE plan itself.
Base vs Variable - What's Normal?
Across our 200+ pre-sales Solutions teams, 87% include a variable component in compensation.
What Splits Are Most Common?
Of that 87%, respondents shared:
37% use a 70:30 mix
31% use 80:20
16% use 75:25
16% - other models (inc flat bonuses)
➤ Who Doesn't Have Variable?
The small subset (13%) without variable in their comp structure mostly include:
Early-stage or very small teams
Flat orgs with less formalised incentive structures
More often in SMB or multi-role setups (e.g. SEs covering presales + post-sales).
Remaining ~16% use alternative models like flat bonuses or business-wide performance pools technically variable, but often perceived differently as SEs feel they lack direct influence over outcomes.
➤ How this varies by target customer size & pricing model?
Across segments there were some interesting patterns:
Enterprise: Mix of 70:30 or 80:20, more SPIFs, and AE:SE loads of 3:1+. Shared and geo-based team targets common.
Mid-market: 70:30 dominant, AE:SE often 2–3:1, more balanced pod-based recognition.
SMB: 70:30 and even 90:10. SPIFs less common, AE:SE sometimes 4:1+. Often team-only targets.
Different revenue models also played a role:
Subscription: More predictable, balanced 60:40 or 70:30 structures, higher SE comp satisfaction.
Usage-Based: AE-heavy ratios, team/pod targets dominate, frustration when contributions aren’t individually rewarded.
Transaction-Based: Few individual levers, shared quotas dominate, lower comp satisfaction.
What do teams have in their variable compensation?
For teams with variable pay, most plans aren’t driven by a single lever. 75% of respondents with variable compensation reported having more than one variable component.
➤ Team-based targets are most common.
Across every pricing model and customer segment, the clearest pattern is that shared team / region targets dominate:
Shared team/region targets appear in ~80–90%+ of responses
Individual-only components are far less common at~35% of respondents
Less than 2% of respondents mentioned CSAT, go-live timing, or other non-revenue metrics. (These low-frequency components are omitted from the chart to reduce visual noise.)
➤ Your variable changes depending on your company's revenue model.
Usage-based and Hybrid models are more likely to include:
- Post-live usage/adoption growth
- Activated revenue
as variable components. Whereas these remain relatively rare in Subscription companies.
Hybrid revenue models (mix of subscription & usage) add the most levers on average - individual revenue, accelerators, post-live metrics. This reflects the reality that hybrid motions span multiple customer types and value moments - but it also means hybrid plans are more likely to become multi-layered.
Usage-based models under-reward individual contribution - despite these companies depending heavily on adoption and expansion, these were rarer components, which helps explain the frustration identified in these teams further in the report.
Transaction-based models were the most rigid and team-pooled, with almost no post-live or quality metrics and the lowest flexibility.
We’ve also looked at whether AE:SE ratio predicts compensation complexity.
It doesn’t. Teams operating at higher ratios are just as likely to run simple compensation plans as those with lower ratios. Where complexity appears more often is in mid-ratio organisations, typically during periods of scale or transition, as teams experiment with balancing individual recognition, team accountability and operational consistency.
What Comp Structure Had Most Satisfaction?
Across responses, a consistent pattern emerges around plan experience: satisfaction tends to be higher when compensation is easy to understand and within a team’s control, and lower when plans become difficult to track.
➤ What we observed drove satisfaction
Individual-only plans with additional recognition mechanisms show the highest satisfaction (≈ 7.5/10), e.g., SPIFs or MBO-style incentives. This result is based on a small sample within our data set, so we treat it as directional rather than definitive.
Team-only plans performed relatively well, particularly when paired with individual recognition levers.
Mixed models combining team + individual + additional components showed the lowest reported satisfaction (≈ 6.3/10). This is the most consistent pattern in this part of the dataset.
Overall, satisfaction appears weakly related to which metrics are included and more related to how the plan is structured and experienced (i.e., whether people can understand how they earn and what they can influence).
➤ In short:
Team + individual + extra levers → tends to correlate with lower satisfaction
Clear, coherent structures → tends to correlate with higher satisfaction
More metrics ≠ more satisfaction
People are satisfied when they:
Understand how their variable is calculated
Feel the targets are achievable
See alignment between AE & SE incentives.
On Complexity and Fairness
“Too many moving parts. I don’t really understand how I earn what I earn.”
“I just want to know what I can influence and how I can get rewarded.”
“We carry a higher quota than AEs with smaller increments, so it’s even harder to make meaningful upside. That’s demotivating.” -IC (at a 300+ headcount company)
On Clarity & Control
“A shared quota across all SEs creates a unified environment where SEs don’t hesitate to support each other. This is balanced nicely with big deal kickers that reward individual effort on the most important opportunities.” -Solutions Director (presales team of 10+)
“Now I’m paid on team, region, and some mystery metric I don’t see. I feel like I do a lot but don’t see it reflected.”
“I like knowing that even in a team setup, I’ve got a personal target I can crush.”
On Frustration with Mixed Models
“Our variable comp is barely achievable. Targets keep increasing, and I will barely achieve 40% of my potential variable max.” -IC (less than 7 yrs in a presales team of 8 with 60:40 structure)
“Team compensation rewards team cohesion and it’s what most people like - but it incentivises everyone to try to work with the best SC, which creates internal politics.” -Manager (50+ headcount)
SPIFS & Accelerators & Non-Revenue Incentives
We asked teams whether they use Solutions SPIFs, accelerators, or bounties as part of variable compensation. 27% of teams (out of the 87% with variable pay) reported using one or more of these levers.
➤ What we saw in how teams implement accelerators.
Across segments and pricing models, accelerators were most often described as a way to reward sustained overperformance (rather than short-term behaviour changes).
Common implementation patterns respondents shared:
Activation point: typically begins just over 100% of quota
Tiered accelerators were common, for example:
100–110%: 2x payout
110–120%: 3x
120%+: 4x
Other variations included “boosters” (e.g., +5% on variable tied to high win rates) and grand-slam style accelerators after annual targets
Most commonly cited multiplier range: ~1.5x to 4x beyond quota
➤ What we saw in how teams implement SPIFs
SPIFs were most often described as quarterly or ad-hoc, and typically tied to a specific strategic push rather than ongoing performance.
Common SPIF triggers mentioned:
New product launches
Large deals (often framed as thresholds like $200K+)
Cross-product / multi-SKU sales
Progression signals (e.g., tech win or moving into an advanced deal stage)
New logo goals (e.g., 3+ in a quarter)
Special focus campaigns (e.g., migrations; occasionally usage/retention)
A subset of respondents described “big deal kickers”: one-off rewards tied to deal size thresholds or strategic accounts. These were more frequently mentioned in Enterprise and Hybrid pricing contexts, and less frequently in Usage-based and SMB contexts.
Common formats included one-off cash bonuses, product prizes (e.g., gift cards), or recognition-based rewards.
➤ What we saw in how teams implement SPIFs
Non-revenue incentives came up far less frequently. Where teams did mention them, they were typically tied to:
enablement creation
product feedback / gap logging
thought leadership
demo assets
But these were are exceptions, not the norm, which aligns with our experience across the Coform community.
➤ What we took away
These levers aren’t universal - most teams with variable pay do not report using them.
Accelerators alone don’t appear to meaningfully predict compensation satisfaction: teams with and without accelerators reported similar satisfaction levels.
The consistent theme across the report holds here too: structure and clarity matter more than adding mechanics. Extra levers can reinforce a clear plan, but they don’t compensate for one that feels hard to understand or hard to influence.
AE Pay & Ratio Affects Solutions Comp Satisfaction
We looked at the relationship between AE pay mix (base:variable split for AEs) and SEs’ satisfaction with their own compensation structure.
➤ What we observed
Within our sample, SE compensation satisfaction is lower in environments where AE plans are heavily skewed toward variable pay.
For example:
When AE pay mix is 80:20, average SE satisfaction is ~6.57/10
When AE pay is 100% variable, average SE satisfaction drops to ~3.5/10
By contrast, where AE plans are more balanced, SE satisfaction is higher:
50:50 AE mix → ~8.4/10 SE satisfaction
60:40 AE mix → ~8.0/10 SE satisfaction
➤ What this may reflect
This does not imply that AE variable pay causes lower SE satisfaction. Rather, it suggests that extreme AE pay models tend to coexist with conditions that are harder for SEs and pattern is consistent with a few dynamics that came up in responses and we hear in Coform:
Pressure and intensity: more aggressive AE incentives can increase pressure on deal cycles that SEs support, especially if SE success is measured differently or with less upside.
Perceived fairness: when outcomes are shared but upside feels uneven (“they win more from our work”), satisfaction can fall even if the SE plan hasn’t changed.
Misaligned recognition: if AE incentives are strongly tied to closing while SE incentives are less visibly connected to impact, teams can experience the system as misaligned.
➤ Satisfaction with ratio strongly correlates with satisfaction with compensation
Among respondents who shared an actual and target AE:SE ratio, 65% were operating at their target ratio whilst 35% were not.
Interestingly being on- or off-target ratio didn't closely correlate to satisfaction. But what did matter was perception.
There was a strong correlation between how SEs were satisfied with their AE:SE ratio and their own compensation satisfaction.
So teams who feel their AE:SE ratio is fair report significantly higher compensation satisfaction - making perceived balance one of the strongest signals in the survey.
➤ Reflecting on your situation
If your AE plan has become more heavily variable and detached from your solutions compensation (or is trending that way), it’s worth pressure-testing two questions with your Solutions team:
Does SE compensation clearly recognise SE contribution in the moments that matter most to the business?
Do AE and SE incentives feel aligned around shared outcomes - or like parallel systems with uneven reward?
This section is one of the clearest examples in the dataset of how comp “satisfaction” is shaped by the wider incentive environment, not just the SE plan in isolation.
How ICs and Leaders View Compensation Differently
We asked every respondent to explain the reasoning behind their satisfaction or lack of satisfaction with their comp structure.
A consistent theme emerged: ICs and leaders often value different things in a comp plan and the best designs work because they deliberately bridge that gap.
➤ The 'empathy gap'
ICs want control, clarity and visible recognition of their personal impact.
Leaders want scalability, predictability and alignment to business goals and team performance.
Good comp design doesn’t choose one side - it makes both sets of needs legible in the plan.
➤ How this shows up in practice
What drives “comp satisfaction” differs by perspective
ICs repeatedly anchored satisfaction in clarity and individual fairness: they want to understand how earnings are calculated and see how their work maps to outcomes.
Leaders more often focused on visibility of team performance and alignment to company targets, and were more willing to tolerate ambiguity as part of running a team.
Team targets vs individual recognition
ICs expressed a clear desire for individual contribution to be recognised, often pointing to mechanisms like MBOs, kickers, or other individual recognition paths even inside team-based plans.
Leaders tended to prefer team or pod-based targets to reinforce shared accountability and reduce internal competition, especially as the org scales.
High AE:SE ratios are experienced differently
ICs most often described high AE:SE ratios as unsustainable, unfair, or overwhelming - a signal that workload and recognition feel out of balance.
Leaders were generally more accepting, often framing it as a headcount/scalability outcome rather than a compensation problem.
➤ A useful nuance - satisfaction differed less by seniority.
Despite these different preferences, reported compensation satisfaction varies little by seniority - ICs, managers, and leaders gave broadly similar satisfaction scores. This reinforces a theme that appears throughout the report: plan design and clarity matter more than title.
Closing Thoughts
Across 200+ pre-sales Solutions teams, the strongest pattern isn’t a single “best” comp structure - it’s that plans work when people understand how they earn, feel they can influence outcomes, and believe the system is fair across Sales + Solutions. Most teams use variable pay and most anchor it on team targets; what separates higher-satisfaction plans is rarely extra mechanics - it’s coherence.
➤ If you're revisiting your team's comp structure:
Can your team explain the plan in two minutes - including how payout is calculated?
Are your variable components tied to outcomes Solutions can actually influence?
Do AE and SE incentives feel aligned in upside, pressure, and recognition?
➤ Why is Coform doing this?
This report was born out of Coform - our invite-only community of Solutioners, coming together across 4 cities and virtually every month to share what's actually working and not.
The idea for Focal, our Solutions OS, and our Research came from our members - we need tools that help us, rather than hold us back, and benchmarks of what actually works, so we can design well & advocate effectively internally.
Our goal with Research is to keep turning community knowledge into shared data, empowering leaders and ICs to position Solutions as the trusted voice of GTM it should be.
➤ Want to support this work?
Share the public page for this research on Linkedin and nudge a couple of your peers at other companies to sign up to contribute to our next research report. The more data points, the more impact we can have.